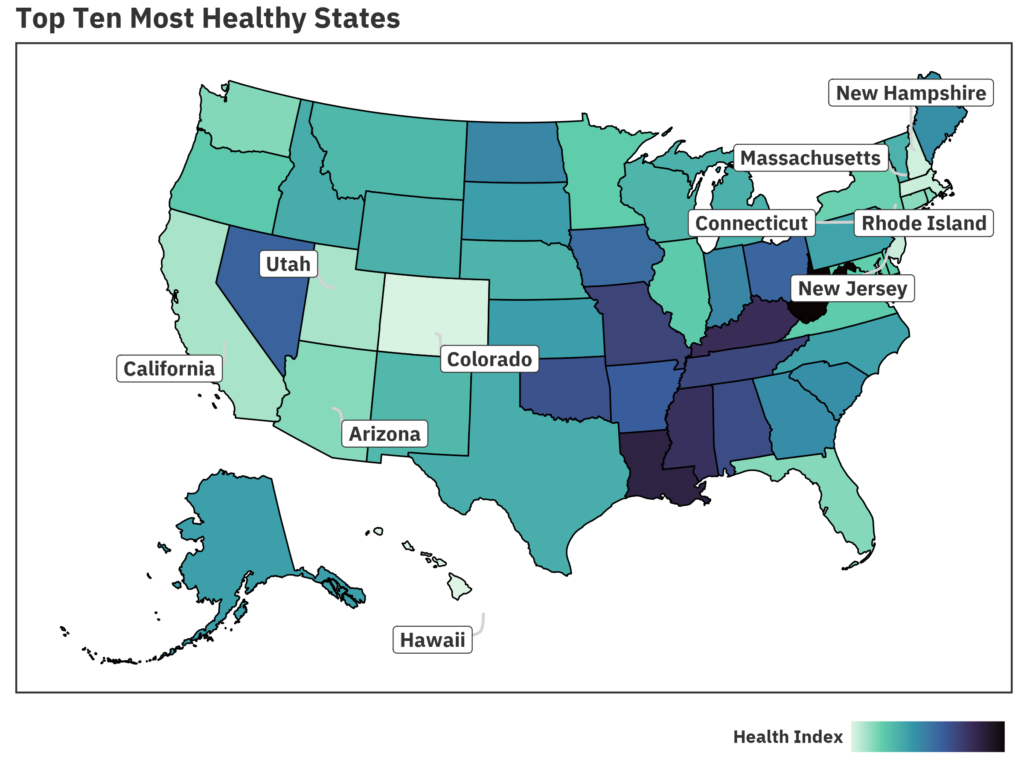
Top Healthiest States in the United States
- Hawaii
- Colorado
- New Hampshire
- New Jersey
- Massachusetts
- California
- Utah
- Connecticut
- Arizona
- Rhode Island
The tropical state of Hawaii ranks as the healthiest state in the Union. It stands out for having low percentages in obesity, heart disease, and tobacco use. This suggests a combination of healthy lifestyle choices contributing to overall health. Colorado follows, with notable low obesity and heart disease percentages and a high exercise percent, emphasizing the importance of physical activity in the state’s health rankings. New Hampshire has a mix of low diabetes and tobacco use percentages and has high social support, as indicated by the better than average social isolation score. Its overall health indicators, including low obesity and heart disease percentages, position it well in the health rankings.
There are potential geographic causes for better health trends in certain states. Places like Hawaii and Colorado, which offer abundant outdoor activities, tend to have populations engaging more in physical activities, contributing to lower obesity rates. The Northeastern states like New Hampshire, New Jersey, and Massachusetts show varied performance across metrics but generally benefit from lower rates of lifestyle-related health issues due to lower rates of substance abuse.

Top 10 Unhealthiest States in the US
- West Virgina
- Louisiana
- Kentucky
- Mississippi
- Missouri
- Tennessee
- Alabama
- Oklahoma
- Arkansas
- Nevada
Defining Healthy and Unhealthy in the United States
Renew Bariatrics set out to determine the state of the health of the United States. By compiling various health metrics from federal government agencies, Renew Bariatrics created a measure to index the overall health of a state’s population. The Health Index combines substance abuse statistics, lifestyle and social indicators, and rates of prominent diseases.
Serious indicators of the poor health of a state closely correlated to rates of tobacco use, incidence of diabetes, and the prevalence of heart disease. Midwestern and Southern states continue to use tobacco at high rates despite the widespread acknowledgement of its negative health impacts. These regions also had relatively high incidence of diabetes and heart disease that also contributed heavily to lowering life expectancy. This could indicate the prevalence of chronic obesity and lack of exercise. In fact, the geographic distribution of diabetes, heart disease, obesity, and lack of exercise are visually very similar.
In general, Midwestern and Southern states did poorly in our Health Index. West Virginia comes in as the most unhealthy state considering a number of factors like extremely high rates of tobacco use and drug overdoses alongside already high rates of diabetes. Other Southern states like Mississippi, Alabama, and Louisiana also mirror these high rates of tobacco use and diabetes.
Geographic Variation in Health Measures

Disease
- Mississippi reports the highest percentage of diabetes in its population.
- Colorado has the lowest incidence of diabetes.
- The average diabetes percentage across the states is about 9.75%.
- Oklahoma has the highest percentage of heart disease, while Minnesota has the lowest.
- Kentucky has the highest cancer rate, with New Mexico having the lowest.
Social Factors
- Utah reports the highest percentage of mental health issues within its population.
- The overall average for mental health issues is approximately 24.17%.
- Relatively high amounts of lack of exercise persist with 77% of people not engaging in regular exercise.
- Obesity tracks lack of exercise and also diabetes.
- Many people report a lack of social support, averaging almost 40%.
Substance Abuse
- Montana has the highest percentage of excessive alcohol consumption.
- Oklahoma has the lowest percentage of heavy drinking.
- West Virginia stands out with the highest drug overdose percentage.
- The average tobacco use rate across all states in the dataset is approximately 22.49%.
- West Virginia has the highest rate of tobacco use at 35.22%.
- California has the lowest rate of tobacco use at 13.22%.

Life Expectancy in the US
Life expectancy in the United States varies state to state by nearly 4 years between the maximum and minimum average age at death. Using data from the National Vital Statistic System shows that the average life expectancy across the states stands at approximately 76.6 years. Renew Bariatrics’ Health Index mirrors the map of life expectancy generally but with some slight differences. Our Health Index didn’t take up several factors that might also contribute to health outcomes such as environmental factors like clean air or water, social and economic factors, or general access to healthcare. These are also important contributing factors but outside of the scope of this article. Still, the important negative health impacts of substance abuse, disease, lack of social support and exercise can be clearly seen in these findings.
State Data Table
| Rank | State | Health Index (0-100) | Heavy Alcohol Use (%) | Diabetes (%) | Drug Overdose (%) | Mental Illness (%) | Social Isolation (%) | Tobacco Use (%) | Lack of Exercise (%) | Obesity (%) | Heart Disease (%) | Cancer (%) | Life Expectancy (years) |
|---|---|---|---|---|---|---|---|---|---|---|---|---|---|
| 1 | West Virginia | 100.0 | 5.7 | 13.1 | 0.0909 | 26.28 | 37.7 | 35.22 | 82.9 | 41 | 0.223 | 0.4475 | 72.8 |
| 2 | Louisiana | 84.5 | 7.3 | 12.4 | 0.0559 | 24.34 | 42.4 | 29.42 | 80.3 | 40.1 | 0.2355 | 0.4331 | 73.1 |
| 3 | Kentucky | 79.0 | 4.6 | 12.3 | 0.0556 | 23.77 | 41.4 | 30.96 | 84.7 | 37.7 | 0.2175 | 0.4634 | 73.5 |
| 4 | Mississippi | 77.4 | 5.9 | 13.7 | 0.0284 | 22.16 | 46.2 | 28.42 | 84.3 | 39.5 | 0.2552 | 0.4096 | 71.9 |
| 5 | Missouri | 69.6 | 8 | 9.9 | 0.0365 | 26.5 | 40 | 29.53 | 82.9 | 36.4 | 0.2024 | 0.4255 | 75.1 |
| 6 | Tennessee | 68.4 | 6.6 | 12.2 | 0.0566 | 25.47 | 38.2 | 27.52 | 78.2 | 38.9 | 0.2238 | 0.4176 | 73.8 |
| 7 | Alabama | 66.2 | 5.9 | 13.3 | 0.0301 | 24.09 | 40.5 | 27.76 | 82.4 | 38.3 | 0.2475 | 0.3999 | 73.2 |
| 8 | Oklahoma | 64.1 | 4.5 | 11.6 | 0.0244 | 25.88 | 37.3 | 28.36 | 84.4 | 40 | 0.2642 | 0.4127 | 74.1 |
| 9 | Arkansas | 59.9 | 7.8 | 10.8 | 0.0223 | 23.86 | 41.5 | 27.85 | 80.7 | 37.4 | 0.231 | 0.4014 | 73.8 |
| 10 | Nevada | 58.1 | 7.4 | 10.2 | 0.0292 | 24.65 | 47.9 | 21.92 | 80 | 33.5 | 0.2081 | NA | 76.3 |
| 11 | Ohio | 57.2 | 6.6 | 10.9 | 0.0481 | 24.52 | 35.9 | 27.69 | 79.1 | 38.1 | 0.2047 | 0.4289 | 75.3 |
| 12 | Iowa | 54.8 | 8.1 | 8.6 | 0.0153 | 26.71 | 40.5 | 23.34 | 80 | 37.4 | 0.1849 | 0.4551 | 77.5 |
| 13 | North Dakota | 45.9 | 8.4 | 8.8 | 0.0172 | 25.95 | 39.6 | 26.22 | 79.9 | 35.4 | 0.1528 | 0.4282 | 76.9 |
| 14 | Indiana | 45.7 | 5.6 | 10.8 | 0.043 | 24.44 | 36.4 | 25.91 | 78.9 | 37.7 | 0.1912 | NA | 75 |
| 15 | Georgia | 43.3 | 6.2 | 11.3 | 0.0235 | 22.52 | 42.3 | 23.69 | 75.9 | 37 | 0.1952 | 0.434 | 75.6 |
| 16 | Maine | 43.2 | 7.9 | 8.2 | 0.0471 | 24.07 | 36.9 | 21.89 | 79.9 | 33.1 | 0.1684 | 0.4495 | 77.8 |
| 17 | South Carolina | 42.9 | 7 | 11.9 | 0.0428 | 22.35 | 39.9 | 24.25 | 77 | 35 | 0.1891 | 0.3945 | 74.8 |
| 18 | South Dakota | 37.4 | 6.6 | 9.6 | 0.0126 | 24.89 | 41.3 | 24.25 | 78.3 | 36.8 | 0.153 | 0.4272 | 76.7 |
| 19 | Kansas | 37.4 | 6.2 | 10 | 0.0243 | 24.41 | 38.2 | 24.23 | 79.2 | 35.7 | 0.1761 | 0.4194 | 76.4 |
| 20 | Alaska | 36.9 | 8.3 | 8 | 0.0356 | 24.96 | 44.6 | 24.71 | 74.4 | 32.1 | 0.1547 | 0.4014 | 76.6 |
| 21 | North Carolina | 36.0 | 6.1 | 11.1 | 0.0392 | 22.19 | 37.7 | 23.13 | 78.4 | 34.1 | 0.1709 | 0.4279 | 76.1 |
| 22 | Pennsylvania | 35.3 | 6.6 | 9.5 | 0.0432 | 23.18 | 38.3 | 22.49 | 78.2 | 33.4 | 0.1806 | 0.4151 | 76.8 |
| 23 | Idaho | 32.4 | 7.2 | 8.8 | 0.019 | 28.02 | 36.7 | 20.14 | 78.3 | 33.2 | 0.1664 | 0.4192 | 78.4 |
| 24 | Texas | 31.8 | 6.9 | 11.1 | 0.0168 | 21.94 | 46.1 | 21 | 75.7 | 35.5 | 0.1807 | 0.3796 | 76.5 |
| 25 | Wyoming | 30.6 | 8.1 | 7.6 | 0.0189 | 27.44 | 38.2 | 26.56 | 75.5 | 34.3 | 0.1594 | 0.3851 | 76.3 |
| 26 | Michigan | 30.2 | 7.2 | 9.3 | 0.0315 | 22.89 | 36.4 | 22.31 | 76.7 | 34.5 | 0.2096 | 0.3964 | 76 |
| 27 | Vermont | 30.1 | 9.8 | 7.1 | 0.0423 | 26.8 | 37.6 | 22.6 | 71.5 | 26.8 | 0.1757 | 0.4179 | 78.8 |
| 28 | Nebraska | 29.6 | 7.3 | 8.6 | 0.0114 | 25.71 | 39.8 | 20.66 | 79.1 | 35.3 | 0.1608 | 0.401 | 77.7 |
| 29 | Wisconsin | 29.1 | 7.9 | 7.9 | 0.0316 | 23.66 | 34.3 | 21.02 | 75.3 | 37.7 | 0.1717 | 0.4313 | 77.7 |
| 30 | Montana | 28.3 | 10.2 | 7.6 | 0.0195 | 27.12 | 36 | 23.34 | 71.7 | 30.5 | 0.1752 | 0.4104 | 76.8 |
| 31 | New Mexico | 28.0 | 6.3 | 11.9 | 0.0516 | 25.67 | 39.2 | 24.31 | 74.3 | 32.4 | 0.1565 | 0.332 | 74.5 |
| 32 | Delaware | 22.2 | 5.5 | 10 | 0.054 | 20.93 | 34.4 | 20.48 | 76.2 | 37.9 | 0.1627 | 0.4011 | 76.7 |
| 33 | Oregon | 22.1 | 8.4 | 8.5 | 0.0268 | 27.48 | 39.3 | 19.56 | 75.1 | 30.9 | 0.1485 | 0.3654 | 78.8 |
| 34 | Illinois | 21.4 | 5.1 | 9.7 | 0.029 | 22.01 | 40 | 20.93 | 76.6 | 33.4 | 0.1698 | 0.4199 | 76.8 |
| 35 | Virginia | 21.2 | 6.7 | 10.2 | 0.0305 | 22.28 | 38 | 19.53 | 77.3 | 35.2 | 0.1672 | 0.3759 | 77.6 |
| 36 | Minnesota | 20.5 | 8 | 7.9 | 0.0245 | 24.74 | 37 | 19.96 | 74.5 | 33.6 | 0.1239 | 0.4364 | 79.1 |
| 37 | Maryland | 20.0 | 5.2 | 9.8 | 0.0428 | 22.37 | 39.5 | 18.08 | 76 | 33.2 | 0.1652 | 0.4075 | 76.8 |
| 38 | New York | 18.5 | 6.1 | 10.1 | 0.0287 | 21.11 | 41.2 | 18.24 | 75.9 | 30.1 | 0.1623 | 0.4274 | 77.7 |
| 39 | Washington | 14.9 | 6.9 | 7.9 | 0.0281 | 27.14 | 38.2 | 17.53 | 74.1 | 31.7 | 0.1477 | 0.391 | 79.2 |
| 40 | Florida | 14.9 | 7.6 | NA | 0.0375 | 20.45 | 39.8 | 18.27 | 73.1 | 31.6 | 0.1513 | 0.4139 | 77.5 |
| 41 | Rhode Island | 14.6 | 6.6 | 9.1 | 0.0417 | 24.67 | 31 | 21.84 | 75.9 | 30.8 | 0.1587 | 0.3961 | 78.2 |
| 42 | Arizona | 14.6 | 7 | 9.7 | 0.0387 | 23.26 | 39.5 | 20.15 | 74.5 | 33.2 | 0.1583 | 0.3368 | 76.3 |
| 43 | Connecticut | 13.8 | 6.1 | 9.3 | 0.0423 | 21.05 | 41.7 | 17.78 | 73.9 | 30.6 | 0.1367 | 0.4191 | 78.4 |
| 44 | Utah | 9.2 | 5 | 8.2 | 0.0211 | 29.19 | 38.3 | 14.05 | 75.1 | 31.1 | 0.1624 | 0.3846 | 78.6 |
| 45 | California | 9.2 | 6.3 | 10.9 | 0.0266 | 22.19 | 44.4 | 13.22 | 77.4 | 28.1 | 0.1478 | 0.3603 | 79 |
| 46 | Massachusetts | 3.7 | 6.7 | 7.8 | 0.0368 | 23.18 | 35.7 | 16.69 | 77.9 | 27.2 | 0.134 | 0.3976 | 79 |
| 47 | New Jersey | 3.5 | 5 | 8.7 | 0.0324 | 19.38 | 40.3 | 14.66 | NA | 29.1 | 0.1575 | 0.4431 | 77.5 |
| 48 | New Hampshire | 2.7 | 7.8 | 7.3 | 0.0323 | 23.06 | 29.7 | 17.69 | 73.6 | 30.2 | 0.1541 | 0.4256 | 79 |
| 49 | Colorado | 1.0 | 8.1 | 6.5 | 0.0314 | 26.3 | 37.9 | 19.79 | 72.7 | 25 | 0.1351 | 0.3632 | 78.3 |
| 50 | Hawaii | 0.0 | 8.1 | 8.1 | 0.0173 | 21.47 | 42.8 | 15.1 | 75.2 | 25.9 | 0.1265 | 0.3883 | 80.7 |
Methodology
The substance abuse statistics considered include tobacco use of any kind, “heavy drinking” and drug overdose percentages. Overdose stats were used as a proxy for rates of dangerous drug usage, instead of illicit drug usage stats that typically include marijuana usage, now legal in many states. Similarly, alcohol usage statistics were restricted to “heavy drinking” as defined by the CDC. Social factors considered were the lack of exercise, incidence of mental illness, and reported lack of social connection. Lack of exercise was defined as the percentage who don’t meet the CDC’s definition of enough “aerobic and muscle strengthening exercises”. Lack of social connection was defined as “adults who sometimes, rarely, or never get the social and emotional support they need” and mental illness was “any mental Illness in the past year”. Disease metrics included the incidence of heart disease, diabetes and cancer. Statistics reported in events of per 100k were converted to percentages. All metrics were normalized into z scores and then aggregated together with equal weight into a Health Index score for ranking. The table reports the ranked number based on the aggregate z score and not the raw z score for legibility. All other metrics reported as percentage of population.
Sources
- Alcohol Use: “Heavy Drinking” from the BRFSS, 2021.
- Tobacco Usage: 2021-2022 National Surveys on Drug Use and Health (NSDUH)
- Drug Use: Drug Overdose Mortality by State, 2021 CDC NCHS (per 100k)
- Heart Disease: National Center for Chronic Disease Prevention and Health Promotion
- Cancer: Incidence data provided by the SEER Program. ( http://seer.cancer.gov ) AAPCs are calculated by the Joinpoint Regression Program ( https://surveillance.cancer.gov/joinpoint/ ) and are based on APCs. Data are age-adjusted to the 2000 US standard population (http://www.seer.cancer.gov/stdpopulations/single_age.html )
- Diabetes: CDC. Diagnosed Diabetes; Total; Adults Aged 18+ Years; Age-Adjusted Percentage; U.S. States; 2021
- Mental Illness: 2021-2022 National Surveys on Drug Use and Health (NSDUH)
- Exercise: CDC Behavioral Risk Factor Surveillance System
- Obesity: CDC Behavioral Risk Factor Surveillance System
- Social Connection: SAMHSA, Center for Behavioral Health Statistics and Quality, National Survey on Drug Use and Health, 2021 and 2022.
- Life Expectancy: Data from the CDC’s National Vital Statistic System, 2022