Interest in bariatric surgery is rising in the United States. Each year, with the exception of 2020, more and different types of obesity reduction surgeries are being performed. Renew Bariatrics gathered together web search data, bariatric surgery center data, and obesity statistics to give a holistic picture of the contemporary landscape of metabolic and bariatric surgical science. Renew Bariatrics compiled this data to create an “Interest Score” that models the popularity of this procedure for US cities and states.
Table of Contents:
- State Findings
- City Findings
- Bariatric Surgery Types
- Methodology
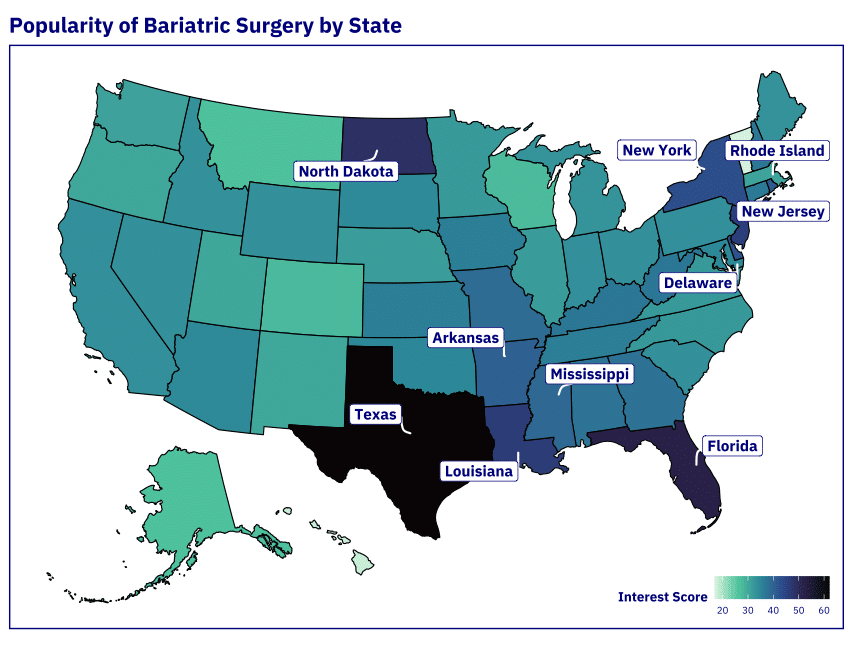
Bariatric Surgery Popularity by State
Unsurprisingly the larger, populous states such as Texas, Florida and New York lead the way in the total number of surgery providers. However, when state populations taken from the Census are included, North Dakota becomes by far the best state for the availability of bariatric surgery per capita. North Dakota with 21 providers comes in as the dark horse in surgical access. Other surprising states in the top five per capita include, Rhode Island, New Hampshire, Louisiana, and Kansas.
Adding in state health monitoring data from the Centers for Disease Control (CDC) helps round out the geographic obesity treatment picture. As a part of the Behavioral Risk Factor Surveillance System (BRFSS) respondents self-report their height and weight. Calculating the Body Mass Index (BMI) from the responses leads to a measure of the percentage of the population that is considered obese. This mapped data shows that obesity risk is concentrated in the Southeast, Midwest and Appalachia. Nearby states with plentiful surgery centers like Texas, Florida, or Illinois are likely to absorb some extra demand from these areas if the actual state’s per capita access score is low.

Further, search keyword data shows the states with the most requested information about surgeons and procedures. Again, the big states like Texas and Florida show their numerical strength. But other states with fewer providers but significant demand drive traffic, such as Arkansas, Mississippi and Delaware. Our Interest Score results capture this nuance of both availability and demand for procedures across disparate states.
Finally, Renew Bariatrics used the providers per state along with the data from the The American Society of Metabolic and Bariatric Surgery to estimate the number of surgeries performed in each state and city. Review the full table below to see how your state stacks up for bariatric medical access.
| State | Surgeons | Estimated Surgeries | Surgeons per 100k | Obesity Rate | Interest Score |
|---|---|---|---|---|---|
| Texas | 301 | 30,377 | 38 | 36% | 62.1 |
| Florida | 157 | 15,844 | 27 | 32% | 52.2 |
| North Dakota | 21 | 2,119 | 100 | 35% | 48.7 |
| Louisiana | 54 | 5,450 | 43 | 40% | 46.3 |
| New Jersey | 96 | 9,688 | 38 | 29% | 45.8 |
| New York | 228 | 23,009 | 42 | 30% | 43.2 |
| Delaware | 10 | 1,009 | 37 | 38% | 42.3 |
| Rhode Island | 16 | 1,615 | 54 | 31% | 41.2 |
| Arkansas | 16 | 1,615 | 20 | 37% | 40.4 |
| Mississippi | 19 | 1,917 | 24 | 40% | 39.1 |
| Missouri | 43 | 4,340 | 26 | 36% | 38.5 |
| Georgia | 63 | 6,358 | 22 | 37% | 37.8 |
| Alabama | 33 | 3,330 | 24 | 38% | 37.5 |
| Kentucky | 24 | 2,422 | 20 | 38% | 37.0 |
| New Hampshire | 20 | 2,018 | 54 | 30% | 37.0 |
| West Virginia | 11 | 1,110 | 23 | 41% | 36.9 |
| Connecticut | 39 | 3,936 | 40 | 31% | 36.6 |
| Kansas | 34 | 3,431 | 43 | 36% | 36.0 |
| Tennessee | 50 | 5,046 | 27 | 39% | 35.9 |
| Iowa | 29 | 2,927 | 34 | 37% | 35.9 |
| Oklahoma | 27 | 2,725 | 25 | 40% | 34.8 |
| Maryland | 44 | 4,440 | 26 | 33% | 34.6 |
| Arizona | 31 | 3,128 | 16 | 33% | 34.4 |
| South Dakota | 10 | 1,009 | 42 | 37% | 34.3 |
| California | 231 | 23,312 | 22 | 28% | 33.7 |
| Indiana | 54 | 5,450 | 29 | 38% | 33.6 |
| Pennsylvania | 116 | 11,707 | 33 | 33% | 33.6 |
| Ohio | 75 | 7,569 | 24 | 38% | 33.5 |
| Nevada | 20 | 2,018 | 24 | 34% | 33.5 |
| Wyoming | 4 | 404 | 26 | 34% | 33.5 |
| South Carolina | 41 | 4,138 | 29 | 35% | 33.4 |
| Idaho | 9 | 908 | 18 | 33% | 33.3 |
| Maine | 14 | 1,413 | 38 | 33% | 33.2 |
| Michigan | 61 | 6,156 | 22 | 35% | 32.9 |
| North Carolina | 91 | 9,184 | 32 | 34% | 32.3 |
| Virginia | 69 | 6,963 | 30 | 35% | 32.2 |
| Minnesota | 53 | 5,349 | 34 | 34% | 32.1 |
| Illinois | 105 | 10,596 | 30 | 33% | 31.8 |
| Nebraska | 15 | 1,514 | 28 | 35% | 31.6 |
| Washington | 65 | 6,560 | 31 | 32% | 30.9 |
| Massachusetts | 67 | 6,762 | 35 | 27% | 30.6 |
| Utah | 16 | 1,615 | 18 | 31% | 30.4 |
| New Mexico | 3 | 303 | 5 | 32% | 30.3 |
| Oregon | 31 | 3,128 | 27 | 31% | 30.2 |
| Colorado | 30 | 3,028 | 19 | 25% | 27.7 |
| Wisconsin | 35 | 3,532 | 22 | 38% | 27.4 |
| Alaska | 2 | 202 | 10 | 32% | 26.8 |
| Montana | 5 | 505 | 17 | 31% | 26.7 |
| Hawaii | 4 | 404 | 10 | 26% | 17.9 |
| Vermont | 1 | 101 | 6 | 27% | 16.9 |

Bariatric Surgery Popularity by City
Drilling down into our city findings shows that Houston, Texas comes out on top of our Interest Score rankings with over 50 surgeons, high obesity risk and significant search popularity. When factoring in the populations of these bustling cities, different centers of bariatric practice emerge. Atlanta and Tampa have significantly higher rates of surgeons per capita, with percentages approximately 193% and 190% above average for urban metros. The average for US cities is 1.97 surgeons per 100,000 people. They are followed by Miami and Dallas. The relative strength of the Southeast should be unsurprising given the prevalence of obesity risk in this area as identified by the CDC.
Miami, in fact, was also highly sought after in the search data with the third highest search volume. Miami shows a significantly higher interest in bariatric surgery, with a search volume 305% above the average. Other metro areas do not have listed bariatric practices but do have substantial potential patient interest indicated in the search volume. Among those, Orlando comes in the highest followed by Birmingham, St. Louis and New Orleans, all with high marks. This again shows the strength of demand for surgical obesity treatment in the Southeast and Midwest.
Look for your city’s information below.
| City | State | Estimated Surgeries | Surgeons | Surgeons per 100k | Obesity Risk | Interest Score |
|---|---|---|---|---|---|---|
| Houston | Texas | 5,551 | 55 | 63 | 36% | 61.9 |
| Atlanta | Georgia | 1,917 | 19 | 100 | 37% | 52.7 |
| Tampa | Florida | 1,514 | 15 | 99 | 32% | 52.6 |
| Miami | Florida | 1,211 | 12 | 70 | 32% | 50.9 |
| Dallas | Texas | 2,523 | 25 | 51 | 36% | 44.1 |
| San Antonio | Texas | 1,817 | 18 | 32 | 36% | 43.2 |
| Raleigh | North Carolina | 1,514 | 15 | 83 | 34% | 40.7 |
| Jacksonville | Florida | 1,514 | 15 | 41 | 32% | 39.5 |
| Las Vegas | Nevada | 1,211 | 12 | 48 | 34% | 39.4 |
| Nashville | Tennessee | 1,615 | 16 | 61 | 39% | 37.9 |
| Tulsa | Oklahoma | 908 | 9 | 57 | 40% | 37.7 |
| Minneapolis | Minnesota | 1,110 | 11 | 68 | 34% | 37.7 |
| Louisville | Kentucky | 1,009 | 10 | 42 | 38% | 37.5 |
| Orlando | Florida | 0 | 0 | 0 | 32% | 37.1 |
| Omaha | Nebraska | 1,211 | 12 | 65 | 35% | 36.9 |
| Baltimore | Maryland | 1,312 | 13 | 60 | 33% | 36.8 |
| Phoenix | Arizona | 505 | 5 | 8 | 33% | 35.3 |
| Fresno | California | 706 | 7 | 34 | 28% | 33.7 |
| Memphis | Tennessee | 505 | 5 | 21 | 39% | 33.0 |
| Portland | Oregon | 1,413 | 14 | 58 | 31% | 32.7 |
| Boston | Massachusetts | 1,312 | 13 | 52 | 27% | 31.7 |
| Chicago | Illinois | 2,422 | 24 | 24 | 33% | 31.3 |
| Austin | Texas | 908 | 9 | 24 | 36% | 31.2 |
| Little Rock | Arkansas | 0 | 0 | 0 | 37% | 31.0 |
| Bakersfield | California | 404 | 4 | 26 | 28% | 31.0 |
| Los Angeles | California | 2,523 | 25 | 17 | 28% | 30.6 |
| Lexington | Kentucky | 0 | 0 | 0 | 38% | 30.5 |
| Birmingham | Alabama | 0 | 0 | 0 | 38% | 30.5 |
| Odessa | Texas | 0 | 0 | 0 | 36% | 30.1 |
| New Orleans | Louisiana | 0 | 0 | 0 | 40% | 30.1 |
| Kansas City | Missouri | 101 | 1 | 5 | 36% | 30.0 |
| Albany | Georgia | 0 | 0 | 0 | 37% | 29.9 |
| Laredo | Texas | 0 | 0 | 0 | 36% | 29.5 |
| Abilene | Texas | 0 | 0 | 0 | 36% | 29.5 |
| Oklahoma City | Oklahoma | 606 | 6 | 23 | 40% | 29.2 |
| Indianapolis | Indiana | 807 | 8 | 24 | 38% | 28.8 |
| Beaumont | Texas | 0 | 0 | 0 | 36% | 28.5 |
| San Angelo | Texas | 0 | 0 | 0 | 36% | 28.4 |
| Colorado Springs | Colorado | 505 | 5 | 27 | 25% | 28.3 |
| El Paso | Texas | 404 | 4 | 16 | 36% | 28.1 |
| Bluefield | West Virginia | 0 | 0 | 0 | 41% | 27.9 |
| Joplin | Missouri | 0 | 0 | 0 | 36% | 27.9 |
| Detroit | Michigan | 505 | 5 | 21 | 35% | 27.8 |
| Columbus | Mississippi | 0 | 0 | 0 | 40% | 27.8 |
| St. Louis | Missouri | 0 | 0 | 0 | 36% | 27.7 |
| Tucson | Arizona | 202 | 2 | 10 | 33% | 27.7 |
| Philadelphia | Pennsylvania | 1,211 | 12 | 20 | 33% | 27.7 |
| Charleston | West Virginia | 0 | 0 | 0 | 41% | 27.6 |
| Columbus | Ohio | 807 | 8 | 23 | 38% | 27.4 |
| Wheeling | West Virginia | 0 | 0 | 0 | 41% | 27.4 |

Bariatric Surgery Types Performed
The American Society of Metabolic and Bariatric Surgery (ASMBS) keeps estimates of the types of surgeries performed each year. A review of trends in this data reveals which surgical methods are becoming more popular with clinicians and patients over time. The dataset tracks five kinds of surgeries: Gastric Sleeve, RYGB (Roux-en-Y Gastric Bypass), Band, BPD-DS (Biliopancreatic Diversion with Duodenal Switch), and Revision surgeries. The most recent data from ASMBS covers the decade between 2011 and 2021.
Overall, the number of procedures is growing in popularity year over year. The effects of the COVID lockdown in 2020 are also clearly visible, as is the swift rebound in procedures to pre-COVID levels in 2021.
The most striking individual trend has been the notable increase in the number of Gastric Sleeve surgeries performed. The number quintupled to over 150,000 in 2021. As a percentage of total procedures Sleeve surgeries started with only 8.9% of the total and rose to a whopping 29.07% in 2021! Gastric sleeve surgeries are the most performed type of bariatric surgery today.
Conversely, Gastric Band surgeries have significantly decreased over the years. From a high of 55,932 in 2011, they dropped to just 1,121 in 2021. There’s a clear downward trend in Band surgeries, decreasing from 17.7% to just 0.21%. This sharp decline indicates a significant shift away from surgeons suggesting this type of surgery.

Methodology:
Renew Bariatrics created rankings of the 50 states and top 50 metro areas by combining provider per capita, search popularity, and obesity risk. Search volume was calculated using one month of 2023 search traffic volume for “Bariatric Surgery in”, “Bariatric Surgeon in” and “Gastric Sleeve” and collated by state or city geography. Search popularity used Google Trends data for “Bariatric Surgery in” and “Sleeve Gastrectomy” for one year, also collated by state or city geography. Interest scores were the normalized average of the surgeons per capita, obesity risk, search volume, and search popularity. Each metric contributed a maximum of 25 points. Estimated surgery numbers assume an even distribution of events across known providers as a straight proportion as more detailed data on performed medical procedures is regulated by federal law.
Sources:
- Data used to create this ranking include propriety surgery center and search data.
- CDC: Behavioral Risk Factor Surveillance System (BRFSS)
- ASMBS: Estimate of Bariatric Surgery Numbers, 2011-2021
- Google: https://trends.google.com/trends/